This item has been sold, but you can get on the Waitlist to be notified if another example becomes available, or purchase a digital scan.
1939 California Division of Mines Map of California Quicksilver (Mercury) Mines
CAQuicksilver-divmines-1939$325.00


Title
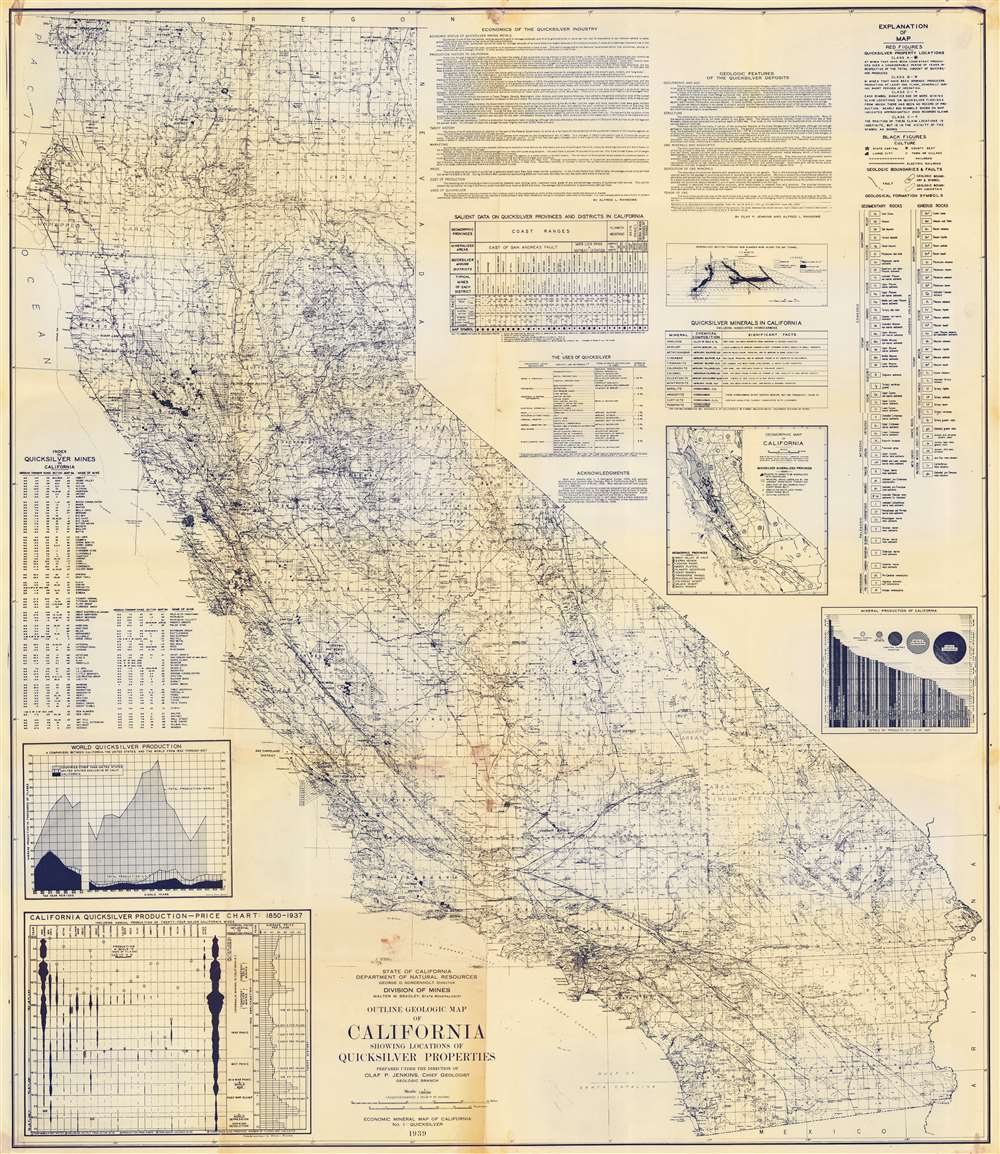
Outline Geologic Map of California Showing Locations of Quicksilver Properties.
1939 (dated) 42.75 x 37 in (108.585 x 93.98 cm) 1 : 1000000
1939 (dated) 42.75 x 37 in (108.585 x 93.98 cm) 1 : 1000000
Description
This is a 1939 CA Dept. of Natural Resources Division of Mines diazotype map of California mercury / quicksilver mines. 117 mines throughout California are numerically identified, most in the Coastal Ranges between Oregon and Santa Barbara. An alphabetical index of quicksilver mines appears along the left, noting the township and range for each.
A Data Driven Piece
A graph below the index illustrates global quicksilver production, with the dark shaded area highlighting quicksilver production in California. Below, in the lower left, a chart follows quicksilver price fluctuations from 1850 - 1937. In the upper right, tables detailing quicksilver areas and a geomorphic map of California provide even more data. Finally, an 'Explanation of Map' situated in the upper right explains the maps iconography.Mercury Mining in California and the American West
California mining is best known for the 1849 Gold Rush, but mercury began earlier and played an equal role in the state's economic development. By 1851, the New Almaden mine was producing half the world's mercury and did so for roughly the next forty years. In fact, the California's richest was a mercury mine. Unlike gold mining (which in the early days of the California Gold Rush was limited to placer panning), mercury required deep subterranean mines. It was also typically encased in cinnabar, so required sophisticated extraction infrastructure. To extract the mercury, the cinnabar was heated until the mercury turned into a gas and released. It would then cool and condense back into a liquid, which could be easily gathered. The history of mining mercury in California has been mostly sidelined by the more romanticized gold and silver discoveries. For more information about the history of mining mercury in California reference Mercury and the Making of California: Mining, Landscape, and Race, 1840 - 1890 by Andrew Scott Johnson and published in 2013 by the University Press of Colorado.Diazo Print or Whiteprint
The diazo print (whiteprint or diazo for short) is a photo reproductive technique best understood as a reverse cyanotype or blueprint. The process yields distinctive blue lines on white paper. Like cyanotypes, the diazo process gained popularity in architecture circles, where it was a simple and effective way to duplicate documents in the field. The earliest diazotypes appeared around 1880 and were adopted for military and field cartographic use from about 1895. The diazo process was commercialized in 1923, when the German firm, Kalle and Company, developed Ozalid, a patented diazo paper that made diazotyping even easier. By the 1950s, it supplemented cyanotypes as the reprographic technique of choice for technical drawings.Publication History and Census
This map was published by the Division of Mines of the California Department of Natural Resources in 1939. It is well represented in institutional collections but is rarely seen on the private market and has no known market history.Condition
Very good. Light wear along original fold lines. Toning along fold lines. Light scuffing near top border. Minor closed margin tears professionally repaired on verso.
References
OCLC 6117648.