This item has been sold, but you can get on the Waitlist to be notified if another example becomes available.
1967 Heezen and Tharp Bathymetric Wall Map of the Indian Ocean
IndianOcean-heezentharp-1964$475.00


Title
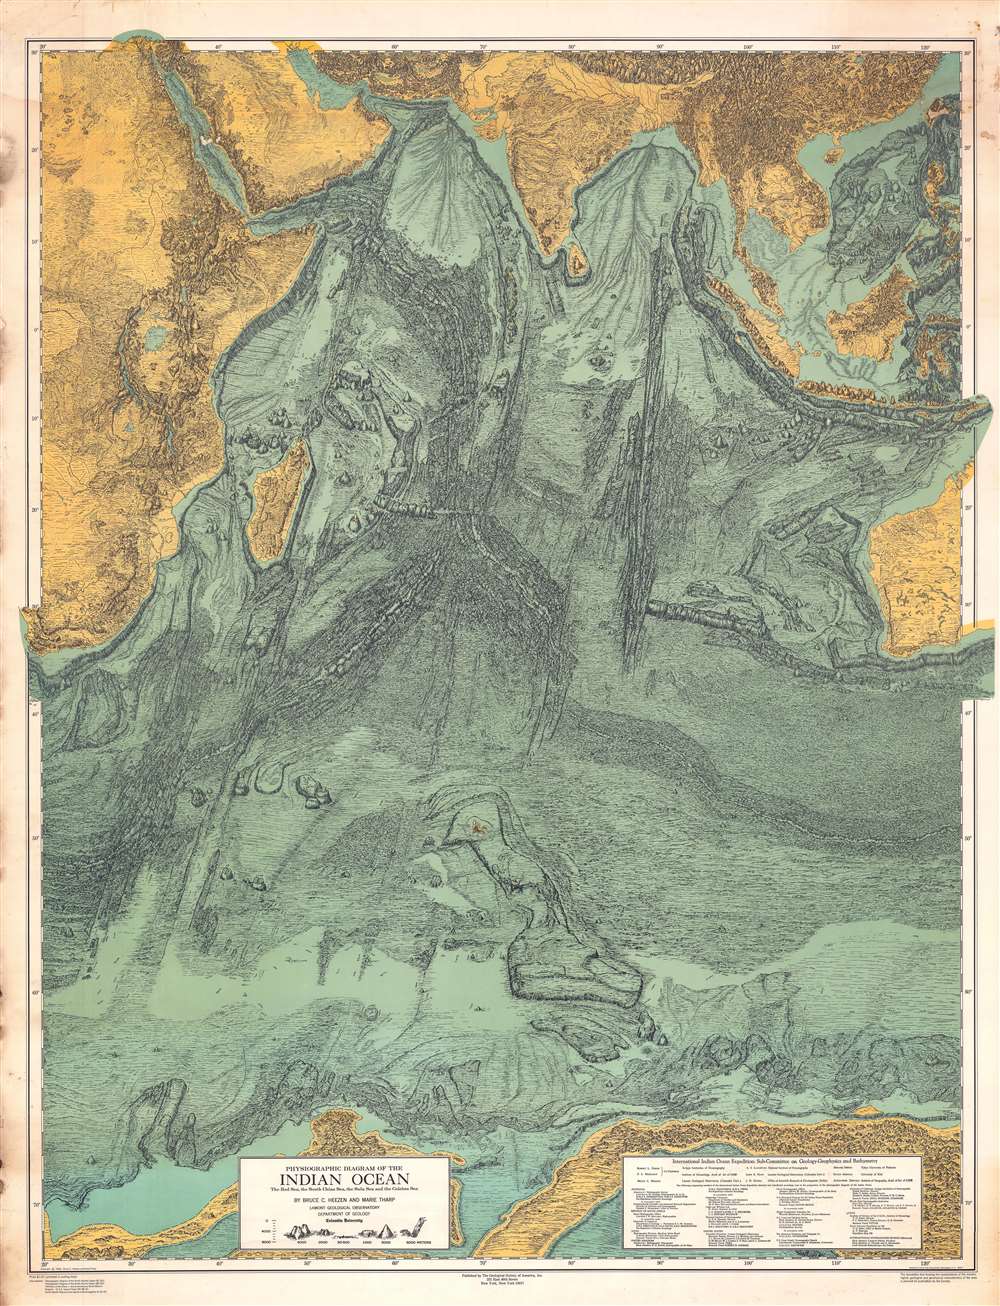
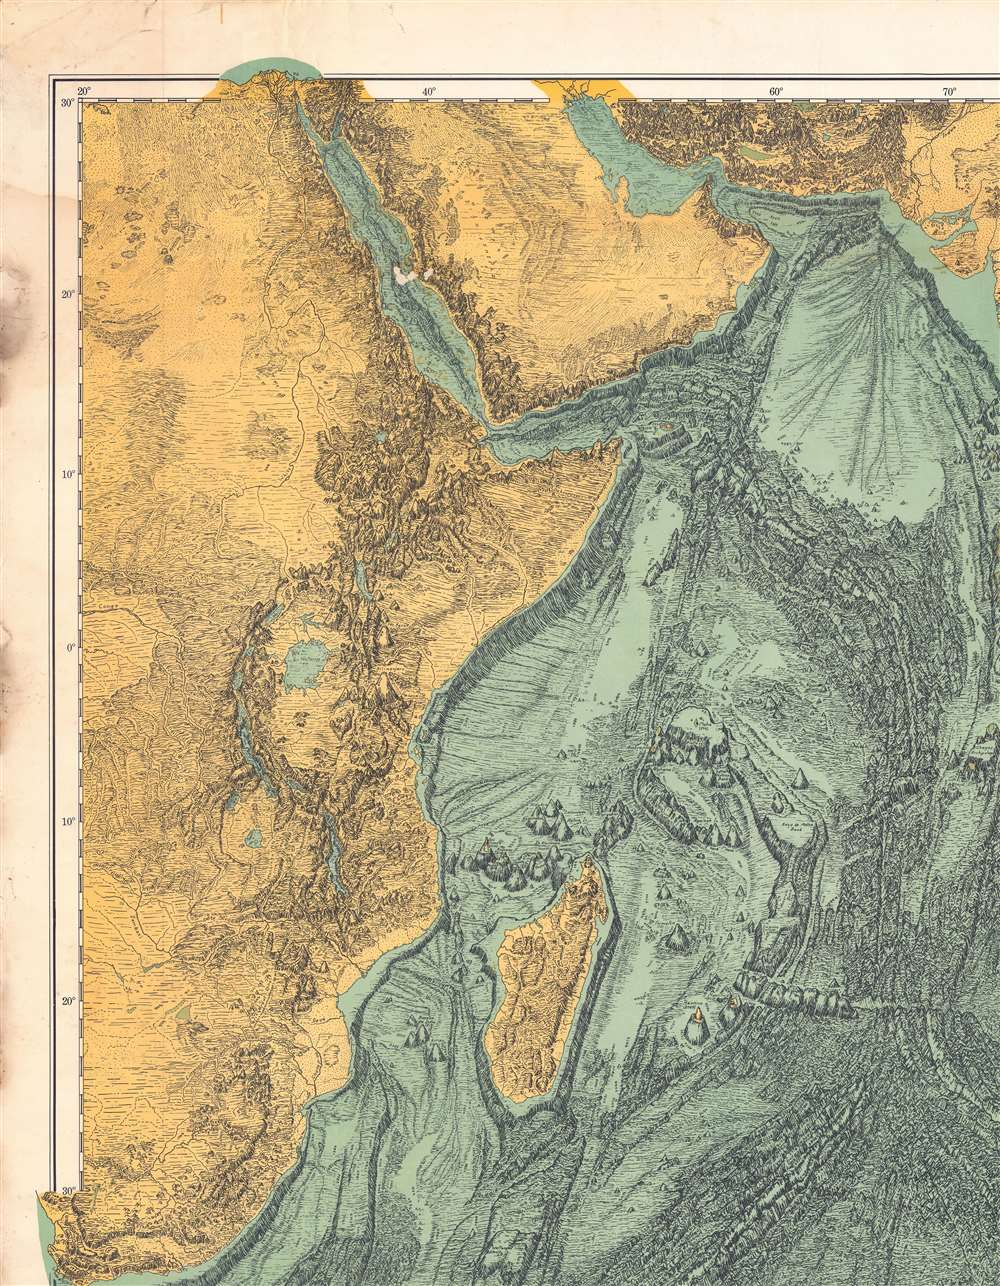
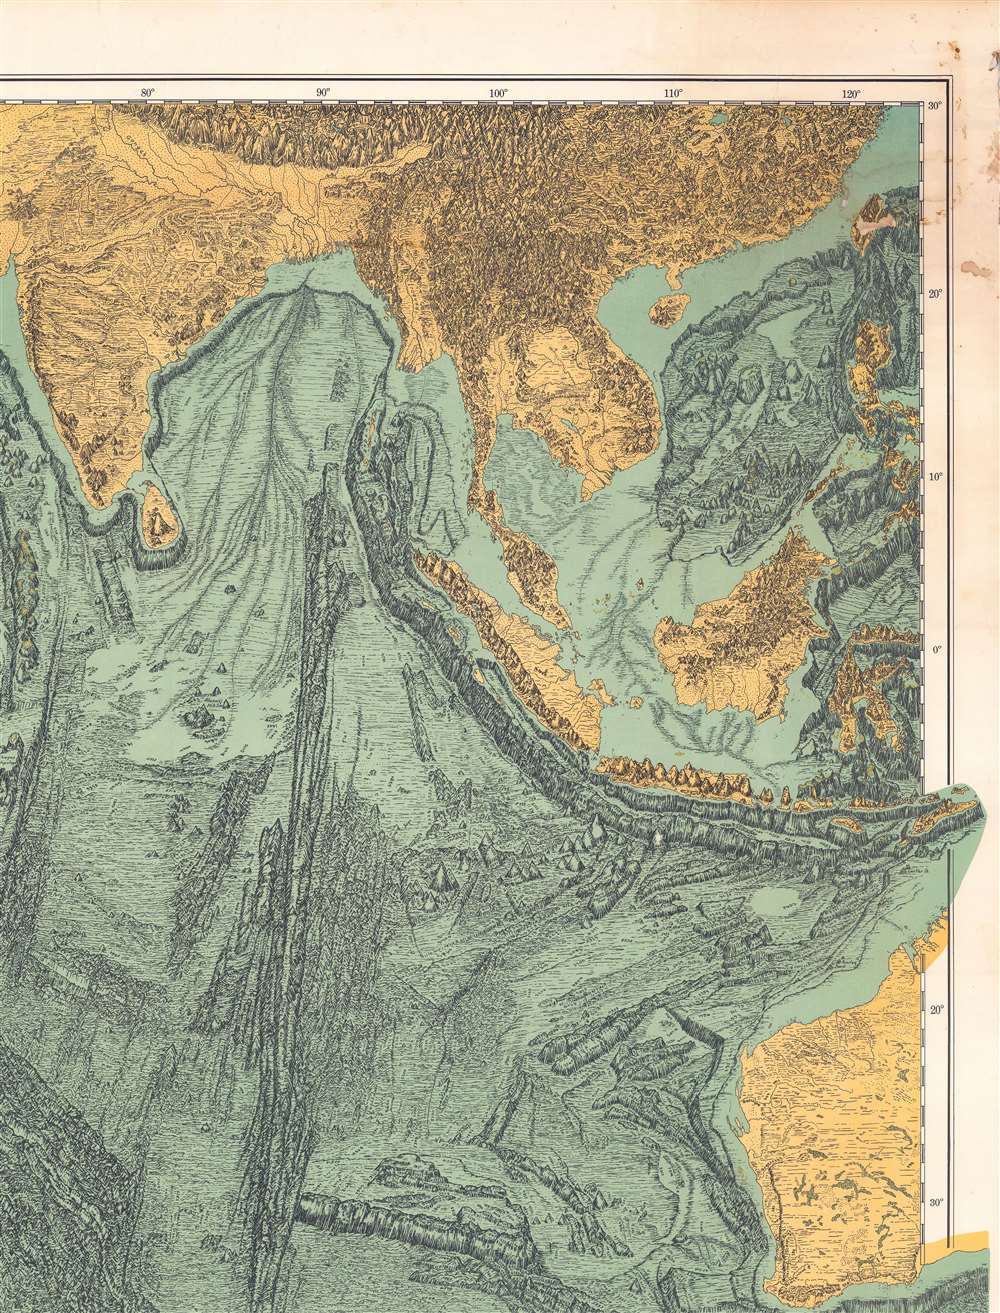
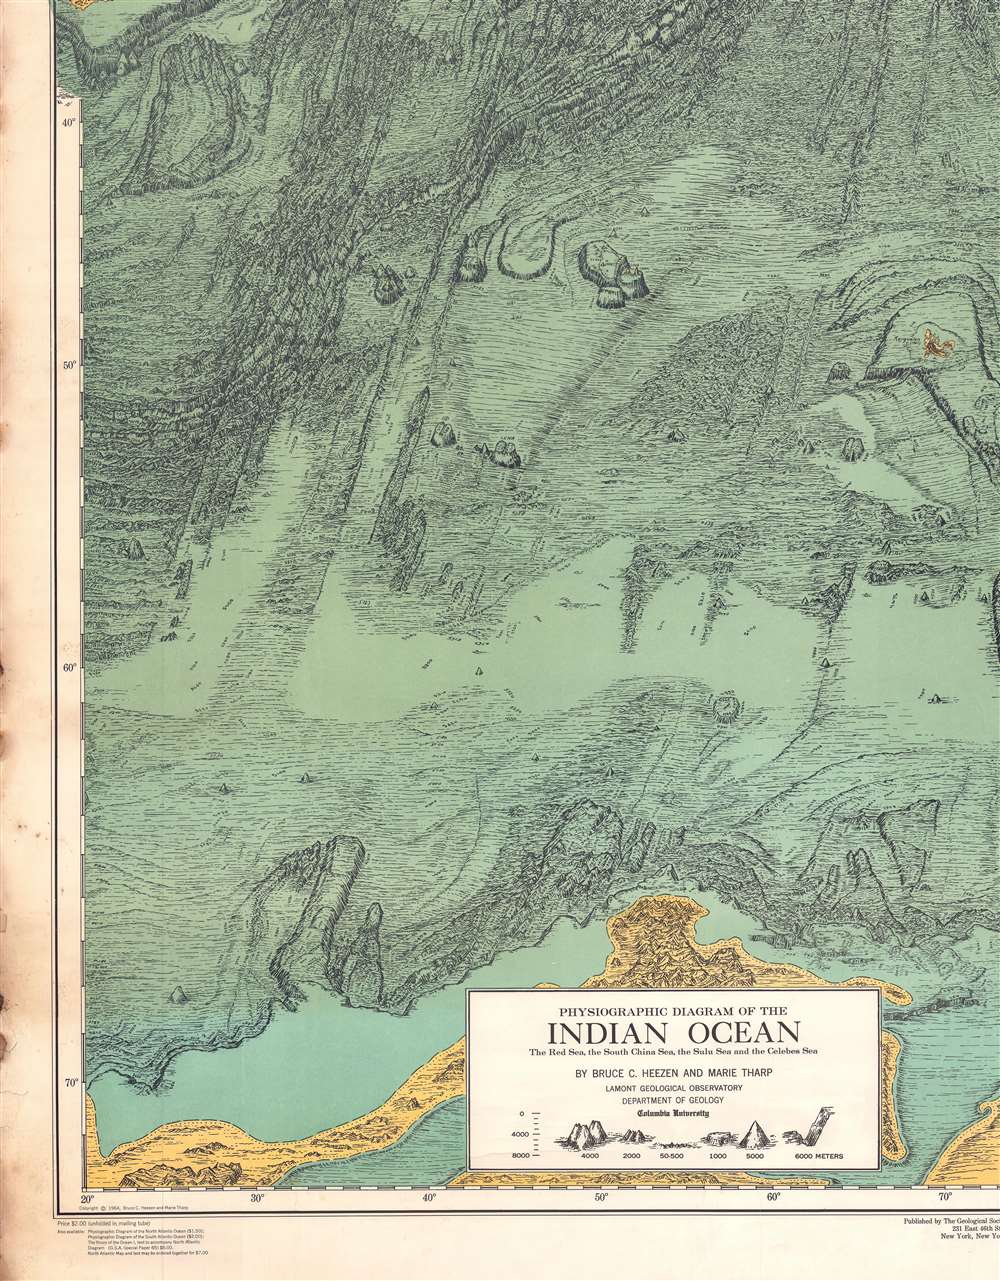
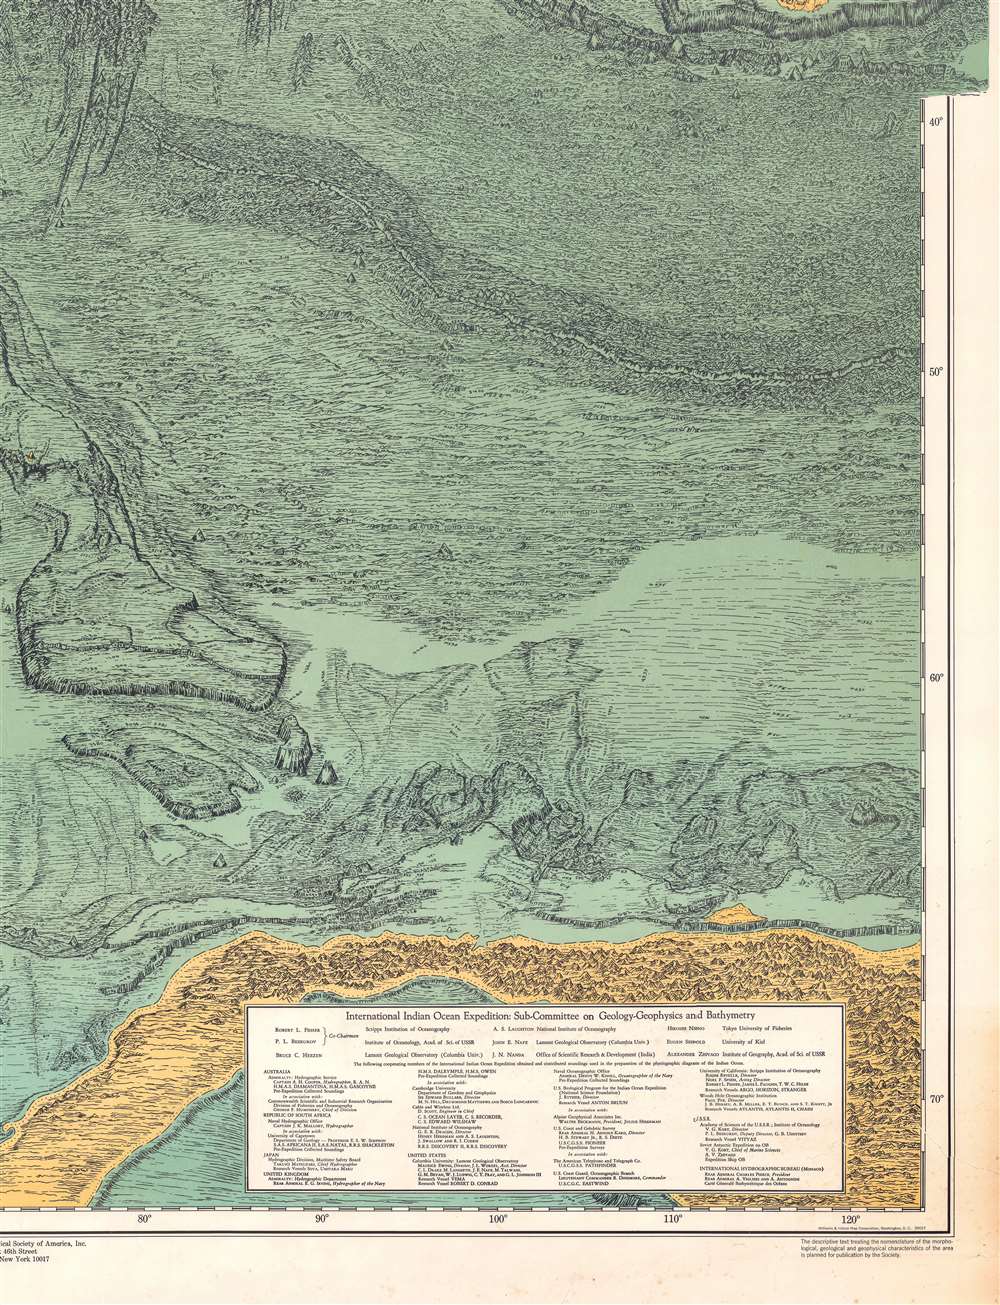
Physiographic Diagram of the Indian Ocean. The Red Sea, the South China Sea, the Sulu Sea and the Celebes Sea.
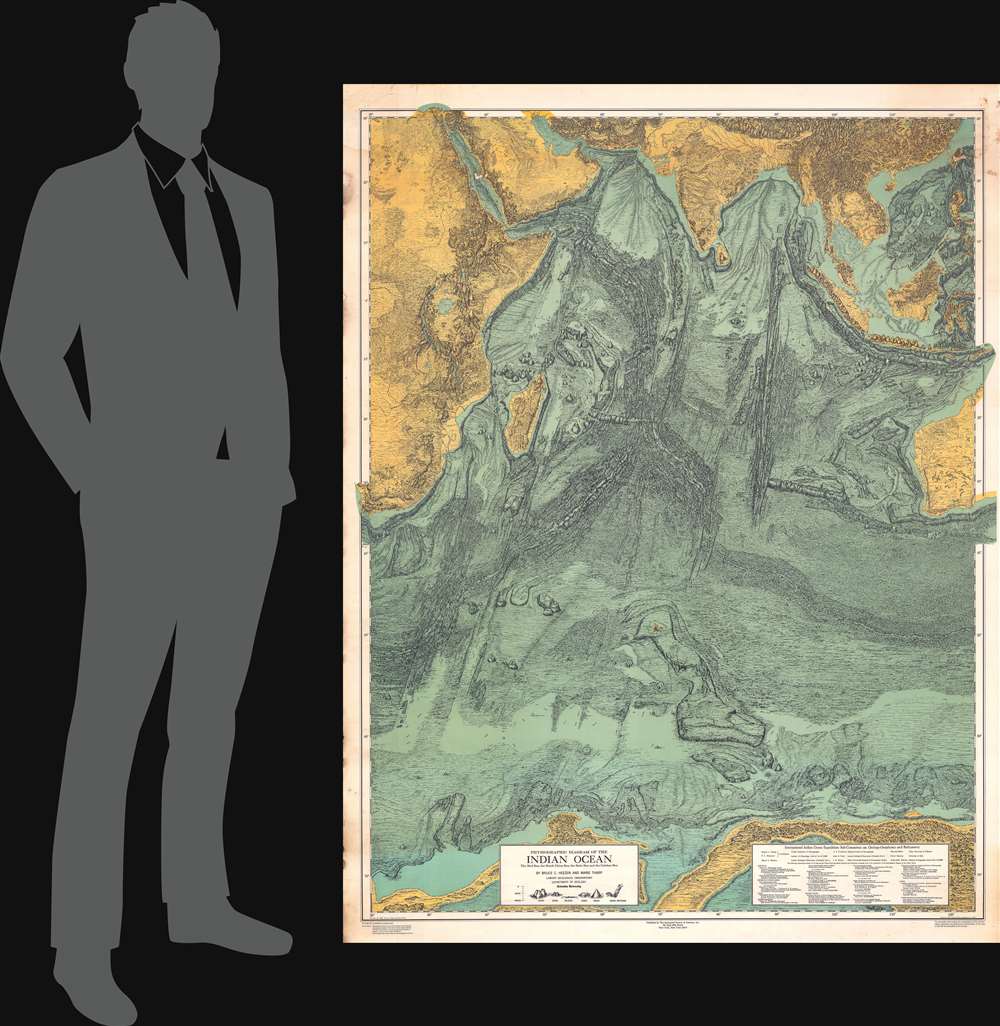
1964 (dated) 64.5 x 49.5 in (163.83 x 125.73 cm) 1 : 10000000
1964 (dated) 64.5 x 49.5 in (163.83 x 125.73 cm) 1 : 10000000
Description
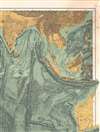
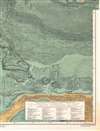
An enormous and visually striking 1974 Bruce C. Heezen and Marie Tharp physiographic map of the Indian Ocean. Coverage extends from the Suez, the Himalayas, and Taiwan south to the Antarctic shelf, and from the Cape of Good Hope to the Philippines. The map offers a striking axonometric view of the terrain throughout, with the focus being the subterranean depths of the Indian Ocean.
Described by a Geologist
Only a fellow geologist can do Heezen and Tharp's map justice, so we quote U.S. Coast and Geodetic Survey geologist Robert S. Dietz, who reviewd the map in Science,This large (4 x 5 feet) and excellent physiographic diagram of the entire Indian Ocean is the third in a series of charts prepared by Heezen and Tharp. (The two previously published diagrams deal with the North Atlantic and South Atlantic areas.) …
Of necessity considerable subjective interpretation is incorporated in such a hatchured diagram, compared to a contoured bathymetric chart, but happily this is the work of professional marine geologists. Most of the sounding data were collected in connection with the International Indian Ocean Expedition, so the chart has been made possible by broad international cooperation, including the sounding of the U.S.S.R.'s ships Vitiaz and Ob. Agencies from participating countries have been given due credit for contributed sounding data…
The diagram opens to view, for the first time, the general geomorphology of a region almost as extensive as the combined area of the North and South Atlantic Oceans. The mid-ocean ridge, so prominent in the Atlantic Ocean, continues through the Indian Ocean where it takes the form of an inverted Y, but it is no longer a geometrically median ridge. Numerous fracture zones are delineated, often generating transcurrent offsets of the topography.
Large, isolated blocks of presumed sialic rock are delineated and have been termed 'microcontinents' by Heezen and Tharp. Remarkable straight north-south lineaments are perhaps the most striking feature of the diagram and should precipitate great speculation or, hopefully, working hypotheses for the interpretation of geologic history of this little-known area. Advocates of continental drift will find comfort in the strong geomorphic suggestion that the Indian subcontinent moved northward as much as 50 degrees, as had been suggested previously by paleomagnetic data.
Publication History and Census
This map was published in New York by the Geological Society of America, based upon research completed by Bruce C. Heezen and Marie Tharp of the Geological Department at Columbia University. It is one of three maps in a series. It is well represented in institutions, but few examples have found their way to the private market.Condition
Very good. Some margin soiling.
References
OCLC 3417253.