1925 Pacific-Southwest Trust 'Midget Map' of Long Beach, California
LongBeach-pacificswtrust-1925$225.00


Title
Midget Map of Long Beach California / Motor and Relief Map of Southern California.
1925 (dated) 13.75 x 12 in (34.925 x 30.48 cm) 1 : 41000
1925 (dated) 13.75 x 12 in (34.925 x 30.48 cm) 1 : 41000
Description
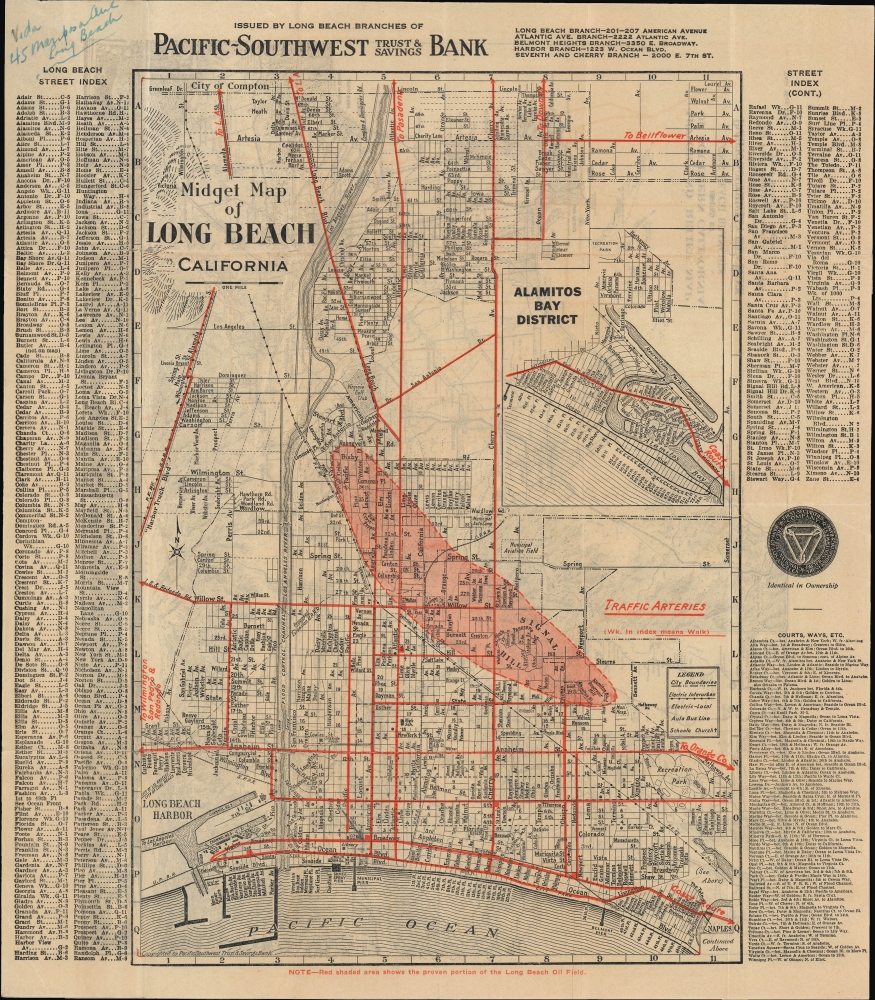
An absorbing 1925 'midget' folding map of Long Beach, California, produced by the Pacific-Southwest Trust and Savings Bank. Among other features, it is notable for highlighting the city's ongoing oil boom and a verso view of the developing road and highway network in the greater Los Angeles metropolitan area.
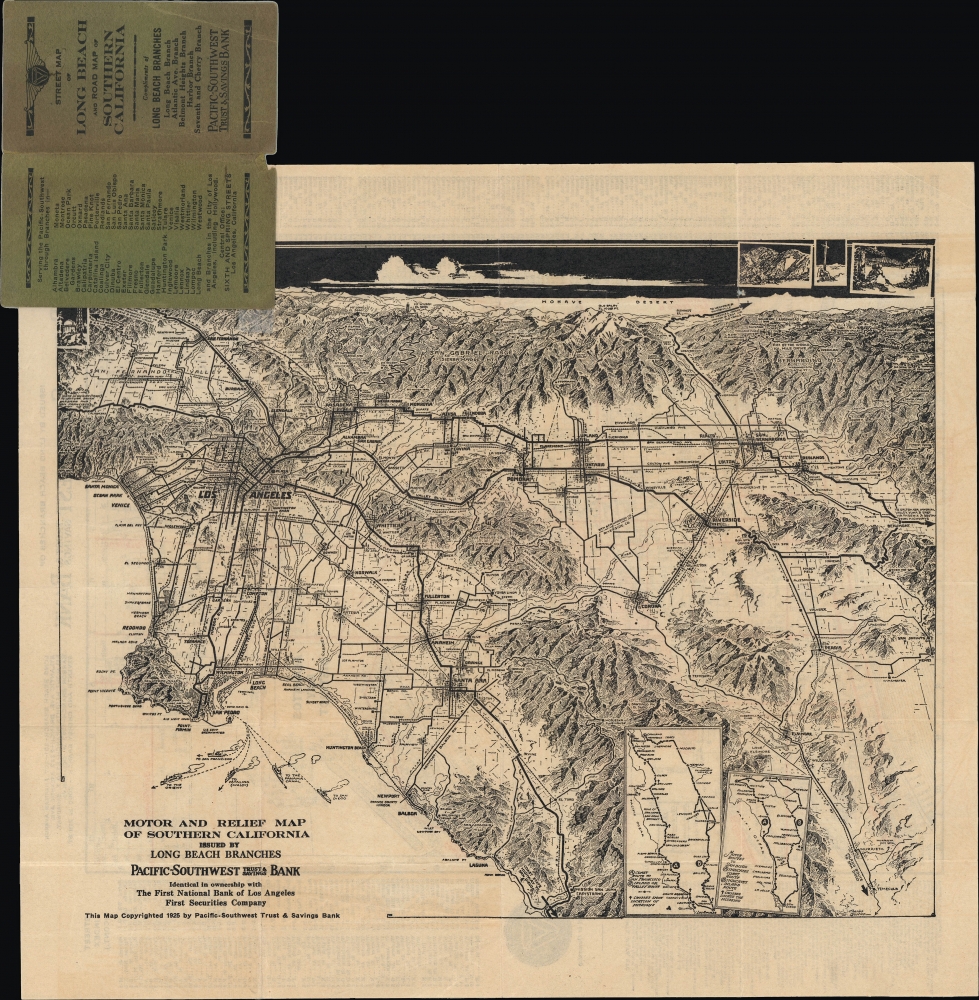
An impressive bird's-eye view of the road network of Southern California between San Fernando and Laguna Beach occupies the verso, along with two insets detailing the road network between San Francisco and Los Angeles and between Los Angeles and San Diego, respectively. Drawn by L.A. Times staff illustrator Charles Owens, this view would be adapted by Owens and republished on other road maps for several years afterward, becoming one of the iconic road maps (or views) of the region at the time.
A Closer Look
The map covers the city of Long Beach, with streets labeled and also listed in an index on either side of the map, corresponding to a grid surrounding it. A large red-shaded area denotes the Long Beach Oil Field, the most productive in the world at the time (discussed below). Red lines trace major traffic arteries, while black lines mark out rail, interurban (Pacific Electric), and streetcar lines. An inset of the Alamitos Bay District, to the southeast of the main map, appears towards the top-right.An impressive bird's-eye view of the road network of Southern California between San Fernando and Laguna Beach occupies the verso, along with two insets detailing the road network between San Francisco and Los Angeles and between Los Angeles and San Diego, respectively. Drawn by L.A. Times staff illustrator Charles Owens, this view would be adapted by Owens and republished on other road maps for several years afterward, becoming one of the iconic road maps (or views) of the region at the time.
The Long Beach Oil Boom
When Long Beach was incorporated in 1897, it was a small and sleepy resort town for Angelinos looking to relax at the beach, similar to Venice or Santa Monica further north. It was the terminus of the first line of the Pacific Electric railcar system (opened in 1902), which would eventually link the entire L.A. metro area. Several housing development projects were also attempted (with limited results), and an upscale shopping district grew into a downtown. However, the city's history changed dramatically when significant oil deposits were discovered there and in nearby Signal Hill in the early 1920s. Hundreds of oil derricks sprung up almost overnight, with Signal Hill being nicknamed 'Porcupine Hill' for the large number of wells sticking out from it. During the 1920s, the Long Beach Oil Field was the most productive in the world. In 1932, the even larger Wilmington Oil Field, which mostly sits below Long Beach, was discovered. The boom caused the population of Long Beach to nearly triple between 1920 and 1930. The city suffered serious damage in the 1933 Long Beach Earthquake, which might have been triggered by oil and gas extraction. In the aftermath of the earthquake, new building standards were adopted throughout the state of California to reduce the risk of buildings collapsing.Publication History and Census
This map was produced by the Pacific-Southwest Trust and Savings Bank, which was created (along with the First National Bank of Los Angeles and First Securities Company) by a merger of twenty banks and financial institutions in 1922. No cartographer is noted on the recto, while the verso view is signed by Charles Owens, a prolific artist in southern California who was the staff illustrator at the Los Angeles Times.Cartographer
Charles Hamilton Owens (Feb 16, 1881 - March 3, 1958) was an American painter and illustrator and staff illustrator for the Los Angeles Times. Born in San Francisco, he had a passion for drawing from a young age. After landing a job as a messenger for The San Francisco Examiner, Owens began being taught his trade by the newspaper's illustrators. Although it is unclear exactly where Owens started his career as a newspaper staff artist, his reputation was launched by his detailed sketches of the 1906 San Francisco earthquake and fire for a New York paper, using only wire reports and his knowledge of the city. By 1910, Owens was working for the Los Angeles Examiner. Even at this point in his career, Owens was known for experimenting with new forms of illustration, fusing drawings of events with photographs. Owens's map of the Titanic disaster used a high oblique perspective, 'capturing the earth's sphericity and showing the polar regions on a curving horizon.' By the 1920s, Owens reputation as an artist in Los Angeles had grown beyond the realm of journalism. He had a studio and received commissions for landscapes and had exhibited watercolors of California and Hawaii landscapes. Thus, when Owens began creating his war series in April/May 1942, he had all the necessary skills to create visually striking works. The Los Angeles Times began a series of maps for its readers, which were full-page inserts that would appear every Monday and Saturday. Owens's maps would be included in the Monday issues, and a Rand McNally map would be included on Saturdays. The Rand McNally maps, however, were discontinued on June 27, 1942, but Owens's maps continued to be printed. His last war map was published on September 10, 1945, a little over a week after the Japanese surrender. Owens died in Los Angeles on March 3, 1958. More by this mapmaker...
Condition
Very good. Light wear along original folds. One small tear at junction of folds professionally repaired. Booklet attached. Map on Verso. Handwriting in blue marker in upper left quadrant and in black pencil in one point on map.